


Restaurant menu engineering compares each item's popularity with its contribution margin to guide pricing, placement, promotion and removal decisions. Start with item-level sales, add current variable costs and compare items within the same menu category. The eight-step process and worksheet below show how to do it.
In Avocado's analysis of 244,398 orders, the top 20% of sold items generated a median 75.3% of item sales. That measures sales concentration, not profit: we did not have complete food-cost data for these restaurants.
We analyzed a complete year of transactions from Avocado's 20 highest-volume restaurant locations. The data confirms that sales concentrate quickly, but the familiar claim that 20% of menu items produce 80% of sales was usually too neat.
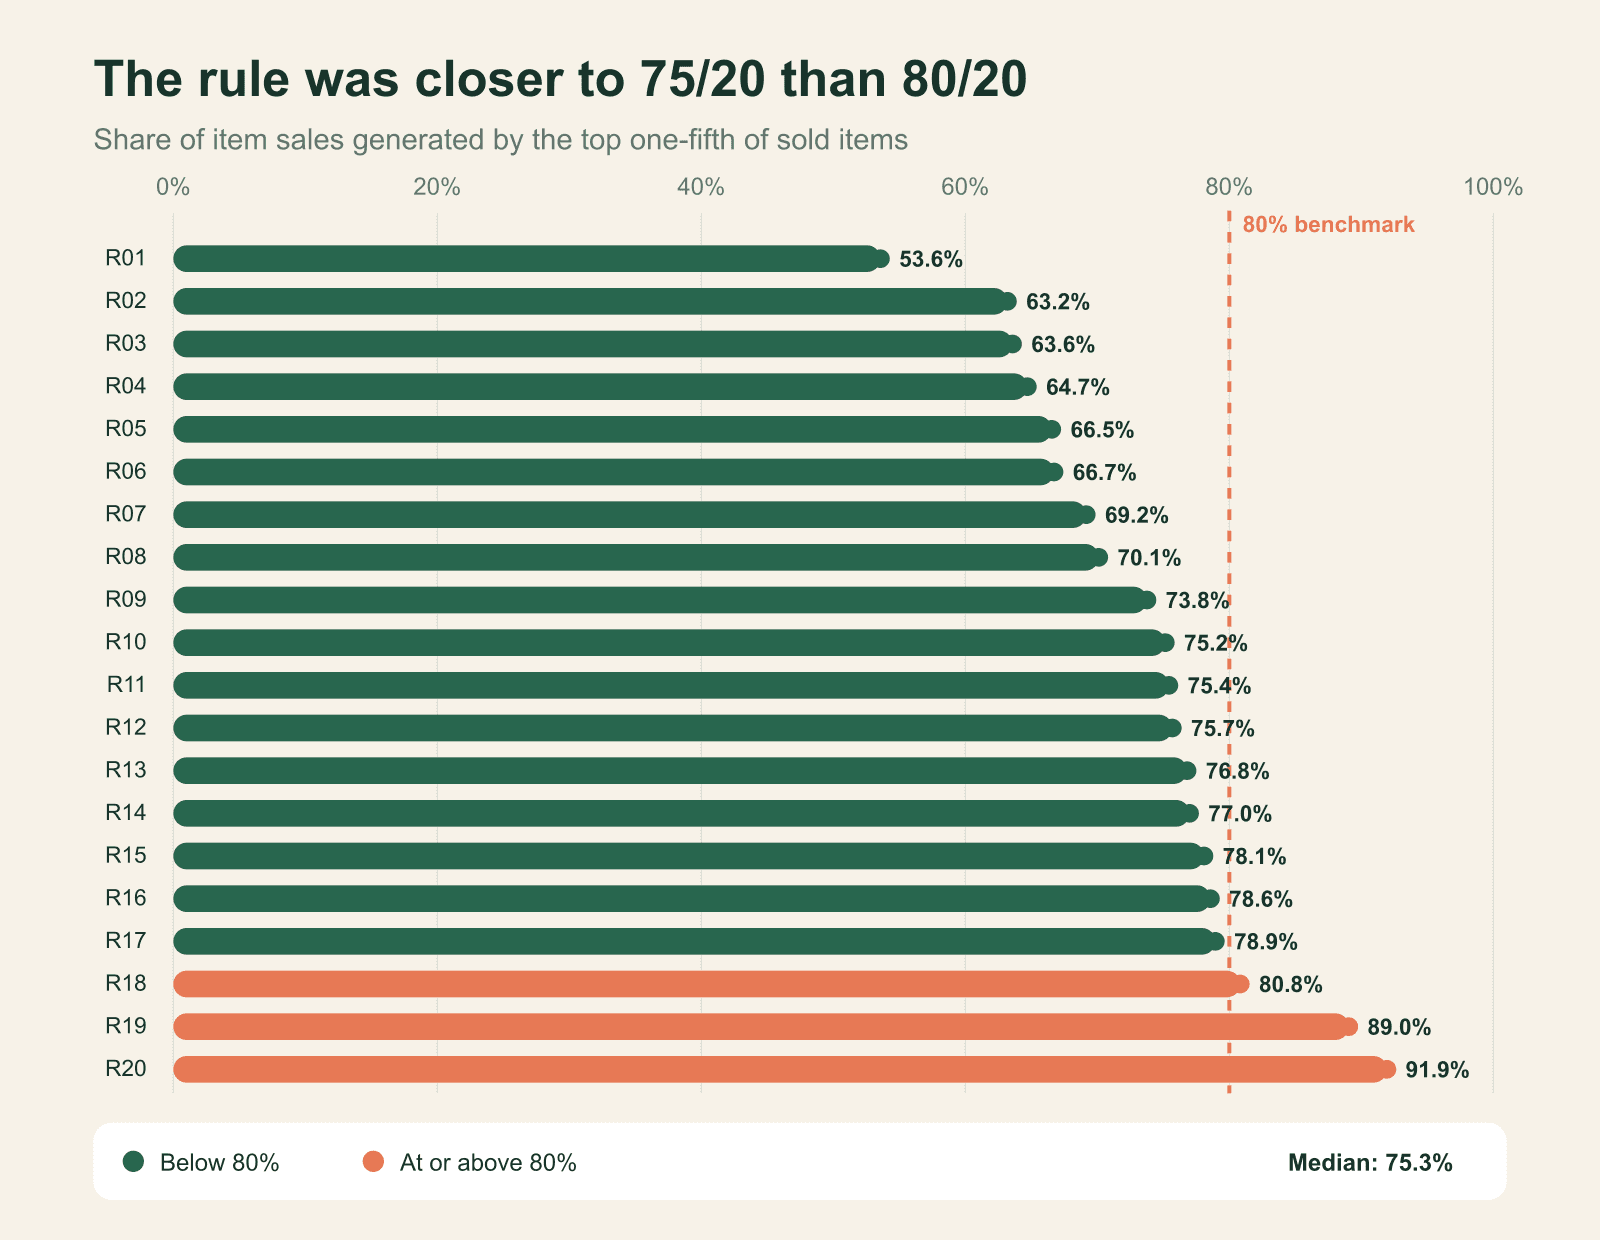
Only three of the 20 restaurants reached a strict 80/20 result. The median location needed 28.1% of its sold items to reach 80% of sales.
The practical lesson is still useful: a small core of items carries most sales. Good menu analysis identifies that core, protects it and then adds food cost before making pricing or removal decisions.
Disclosure: Avocado provides point-of-sale, menu, payment and reporting tools for restaurants. This analysis uses anonymized, aggregated transaction data from restaurants using Avocado. No restaurant or customer is identified.
Restaurant menu engineering results at a glance
Finding | Median result |
|---|---|
Sales generated by the top 20% of sold items | 75.3% |
Share of sold items needed to reach 80% of sales | 28.1% |
Sales generated by the top five items | 53.6% |
Sales generated by the top 10 items | 72.0% |
Sales generated by the bottom half of sold items | 4.1% |
Restaurants where the top 20% generated at least 80% | 3 of 20 |
The typical restaurant in the study sold 51 distinct items during the year. Menu sizes ranged from four sold items to 137.
What is restaurant menu engineering?
Restaurant menu engineering compares two measures for every item:
Popularity: how often the item sells or how much item sales it generates.
Contribution margin: the selling price minus the variable cost required to make the item.
The goal is to make better decisions about pricing, placement, descriptions, promotion and kitchen complexity. It is not a command to shrink every menu or promote the item with the highest price.
Popularity and profitability answer different questions. A bestseller can produce weak margins because of expensive ingredients or oversized portions. A less popular dish can still earn strong profit on every sale.
Our study measures the popularity side using item sales. Avocado did not have complete food-cost data for this cohort, so the findings should not be treated as a profitability ranking.
The menu engineering matrix
The standard menu engineering matrix places each item into one of four categories after comparing popularity and contribution margin within a relevant category.
Star
Popularity: High
Contribution margin: High
Common response: Protect consistency, availability and placement
Plowhorse
Popularity: High
Contribution margin: Low
Common response: Review price, portion size and ingredient cost
Puzzle
Popularity: Low
Contribution margin: High
Common response: Test naming, placement, photography and staff recommendations
Dog
Popularity: Low
Contribution margin: Low
Common response: Simplify, redesign or remove unless it serves a strategic purpose
Compare like with like. Drinks should compete with drinks, breakfast tacos with breakfast tacos, and entrées with similar entrées. A beverage may be important to the business even when it does not match the sales of a main dish.
The labels are starting points, not verdicts. A low-volume item may serve an important dietary need, share ingredients with a bestseller or distinguish the restaurant from nearby competitors.
Worked menu engineering example: four entrées
This fictional example shows the full popularity-and-margin calculation. These items and costs are not from the Avocado study. Suppose an entrée category uses 100 units sold as its high-popularity cutoff and $10 per item as its high-contribution-margin cutoff for the same review period.
Contribution margin per item = selling price − variable cost. Multiply that margin by units sold to estimate total contribution dollars before fixed costs. Set cutoffs using your own category and period; the numbers here only illustrate the classification.
Entrée | Units sold | Price | Variable cost | Margin per item | Matrix group |
|---|---|---|---|---|---|
Chicken bowl | 180 | $16 | $6 | $10 | Star |
Burger | 160 | $15 | $8 | $7 | Plowhorse |
Salmon plate | 50 | $24 | $8 | $16 | Puzzle |
Pasta | 40 | $14 | $7 | $7 | Dog |
The chicken bowl contributed an estimated $1,800 before fixed costs (180 × $10), while the burger contributed $1,120 (160 × $7). That does not mean you should immediately raise the burger price or delete the pasta. Test portion cost, price and placement, then compare units sold and total contribution dollars after each change.
How the restaurant menu 80/20 rule fits
The menu 80/20 rule applies the Pareto principle to restaurant sales. It suggests that roughly 20% of menu items account for roughly 80% of results.
The word roughly matters. A restaurant can be closer to 70/30, 75/25 or 90/15 depending on its concept, menu size, prices and ordering behavior.
At the median restaurant in this study, the highest-selling 10% of items generated 56.4% of item sales. The top 20% generated 75.3%, and the top 30% generated 85.3%.
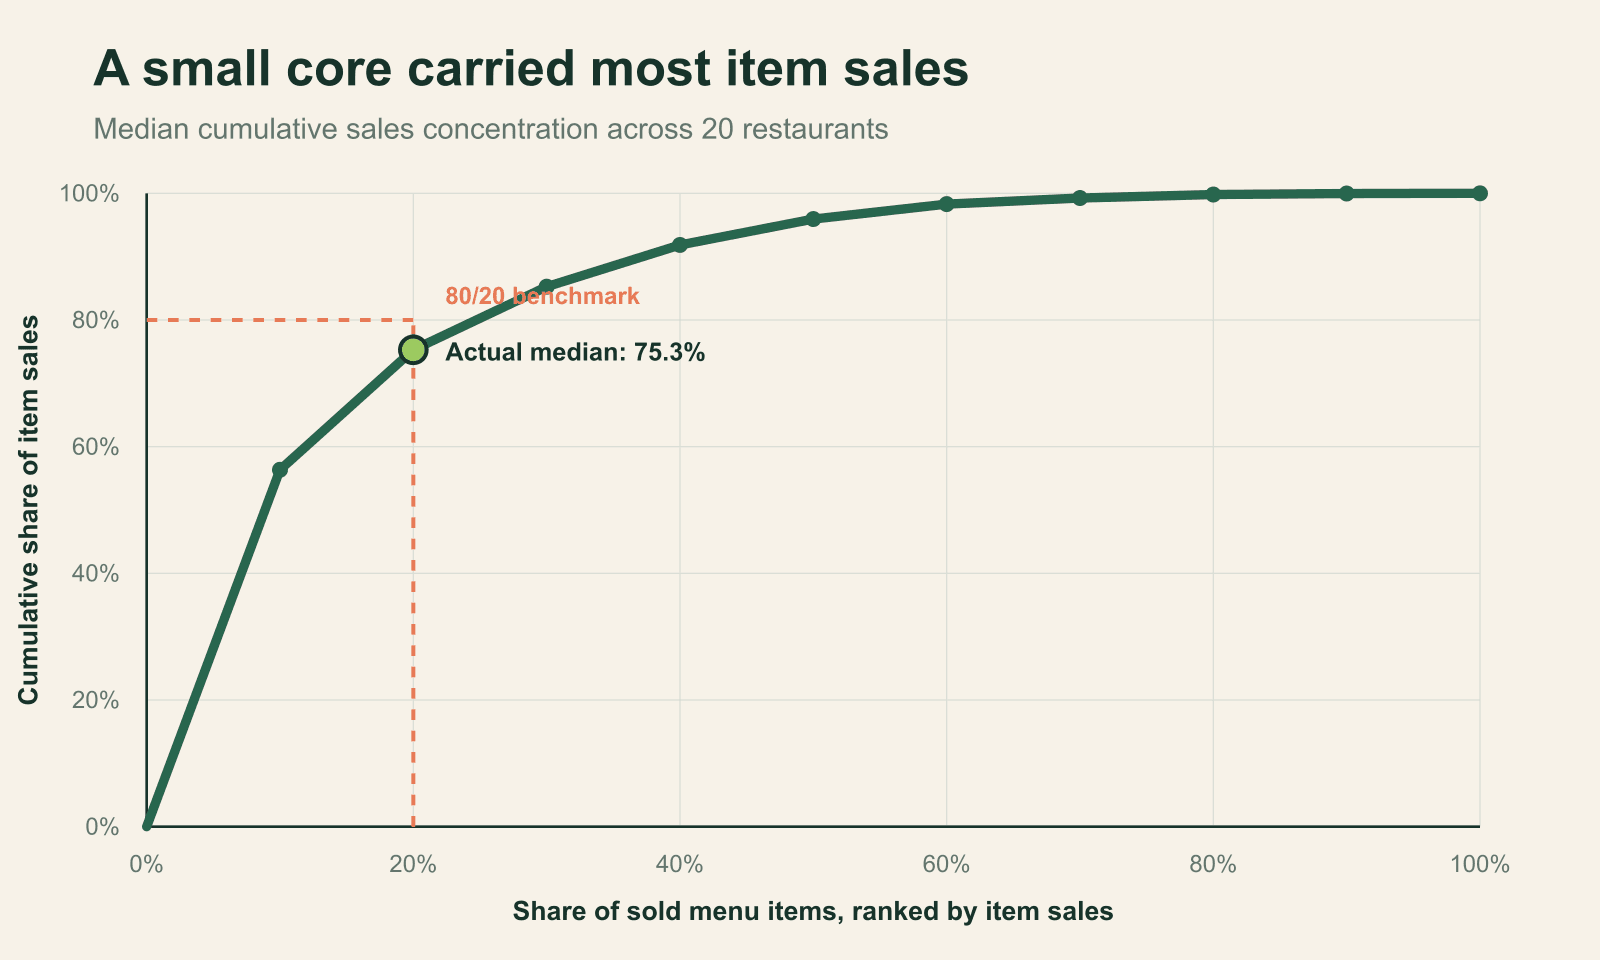
Only three restaurants generated at least 80% of item sales from their top one-fifth of sold items, rounded up to the next whole item. Across all 20 restaurants, the top-fifth share ranged from 53.6% to 91.9%.
Thirteen restaurants needed 30% or less of their sold items to reach 80% of item sales. The literal rule often missed, but strong concentration was still normal.
What the restaurant order data tells you before adding costs
Consider the median restaurant in the study:
51 distinct items recorded positive sales.
The top five items generated 53.6% of item sales.
The top 10 items generated 72.0%.
The top 20% of items generated 75.3%.
About 28% of items were needed to reach 80% of sales.
The bottom half of items generated only 4.1%.
This first pass reveals the restaurant's sales backbone. The owner now knows which items deserve the most attention during inventory planning, menu redesigns and kitchen training.
It does not yet reveal which items are Stars or Plowhorses. That requires contribution margin. The next step is to add recipe cost and compare popularity with margin inside each menu category.
Did menu size change the pattern?
We divided the 20 locations into three descriptive groups based on the number of items that recorded positive sales.
Small menu: 4 - 30 items
Restaurants analyzed: 6
Median sales generated by the top 20% of items: 76.8%
Median share of items needed to reach 80% of sales: 32.5%
Medium menu: 31 - 70 items
Restaurants analyzed: 9
Median sales generated by the top 20% of items: 73.8%
Median share of items needed to reach 80% of sales: 27.7%
Large menu: 71 - 137 items
Restaurants analyzed: 5
Median sales generated by the top 20% of items: 75.7%
Median share of items needed to reach 80% of sales: 25.3%
The top fifth generated a similar sales share across all three groups. Larger menus needed a slightly smaller percentage of items to reach 80%, but the subgroups are too small to turn that difference into a general rule.
Small menus also create a rounding problem. One item can represent much more than 20% of the menu. Owners should focus on the full concentration curve and the actual number of important items, not one ratio.
A simple menu engineering worksheet
Build a spreadsheet with one row per item and the following columns. Use the same date range for sales and costs, and calculate each item within its menu category:
Worksheet column | What to enter or calculate |
|---|---|
Item name | A consistent name with duplicates combined |
Menu category | The comparable group, such as entrées or drinks |
Units sold | Paid quantity after cancellations |
Item sales | Sales after item-level discounts |
Selling price | Current menu price |
Variable cost | Ingredient and other per-item costs |
Contribution margin | Selling price − variable cost, per item |
Popularity share | Item units ÷ total units in the same category |
Cumulative sales share | Running total after ranking items by sales |
Matrix category | Compare item units and margin with documented category cutoffs; label Star, Plowhorse, Puzzle or Dog |
Decision | Protect, reprice, promote, simplify, test or remove |
For example, an item selling 80 of 1,000 category units has an 8% popularity share. At a $17 selling price and $6 variable cost, its contribution margin is $11 per item. If it sold 80 units, it produced $880 in contribution dollars before fixed costs. Keep permanent items separate from limited-time offers. Note launch dates, price changes and stockouts so a short selling window is not mistaken for weak demand.
How to do menu engineering in eight steps
1. Choose a representative date range
Start with at least 90 days. Use a full year when seasonality matters. Compare similar periods if your restaurant has changed hours, locations or ordering channels.
2. Clean the item list
Combine duplicate names that represent the same product. Remove gift cards, open-priced adjustments, canceled quantities and test orders.
3. Separate items into categories
Build fair comparison groups. A side dish should not need to outsell a signature entrée to earn its place.
4. Calculate popularity
Measure units sold, item sales and each item's share of category sales. Rank the items and calculate cumulative sales share to see how quickly sales concentrate.
5. Calculate contribution margin
Subtract variable cost from selling price. Use current recipe and ingredient costs rather than relying on an old food-cost percentage.
6. Build the menu engineering matrix
Set popularity and margin thresholds for each category, then classify the items. Record the thresholds so the next review uses the same method.
7. Choose one test per item
Possible tests include a price change, smaller portion, clearer name, new photo, better placement, staff prompt or removal. Avoid changing several variables at once if you want to learn what worked.
8. Measure the result
Review the sales mix monthly and conduct a deeper menu review quarterly. Compare contribution dollars, not only percentages.
If your current system cannot produce a clean item-level export, make reporting depth one of the essential questions you ask when choosing a POS system.
How does a POS help with menu engineering and pricing decisions?
A restaurant POS can supply item-level units sold, item sales after discounts, order dates and sales by location or ordering channel. Export those fields for the same period, clean duplicate item names, then calculate each item's share of its menu category. Use that report to find the sales core and identify which items deserve a margin review.
Sales reports alone cannot tell you whether an item is profitable. Add current recipe costs, packaging and other variable costs from your own records to calculate contribution margin. If you change a price, compare units sold and total contribution dollars before and after the test, accounting for promotions, stockouts and seasonal shifts. A higher margin per item is not a win if lost volume reduces total contribution.
Five menu optimization decisions to make first
Protect the items carrying the business
Top sellers should be consistently available, easy to find on every ordering channel, correctly priced and supported by a clear kitchen display workflow.
A stockout or quality problem on a top-five item can affect a much larger share of sales than the same problem on a fringe item.
Review the bottom half, but do not delete it blindly
At the median restaurant, the bottom half of sold items generated 4.1% of item sales. Review these items for margin, ingredient overlap, preparation time and strategic purpose.
Low sales plus weak margin, unique ingredients and high kitchen complexity is a strong case for change. Low sales alone is not.
Reprice popular items carefully
A popular, low-margin item may need a price or portion adjustment. Test the smallest change that brings contribution margin closer to the category target, then watch units and total contribution dollars.
Improve profitable items that customers overlook
For a high-margin, low-popularity item, test the name, description, photography, menu position and staff recommendation before removing it.
Track operational cost alongside food cost
Two items with the same contribution margin can create different results if one slows the line, requires special prep or produces frequent remakes. Add preparation time and ingredient complexity to the final decision.
Study methodology and limitations
The Avocado Data Lab analyzed the 20 restaurant locations with the highest paid-order counts between August 1, 2025 and July 31, 2026. The final sample contained 244,398 paid, non-canceled orders.
For every restaurant, we:
Combined item names after normalizing capitalization and spacing
Removed custom items and gift-card purchases
Excluded fully canceled quantities and prorated partially canceled quantities
Ranked items by recorded line-item sales after item-level discounts and before tax, tips and fees
Calculated each location's concentration independently
Reported the median location so the largest restaurant did not dominate the result
The study measures items that recorded positive sales during the period, not every item currently displayed on a menu. Order-level discounts were not allocated back to individual items.
The cohort is not a representative sample of every U.S. restaurant. Sixteen locations were in Texas, one was in Utah and three lacked usable location data. The sample also contains many Mexican and Latin quick-service concepts. Treat the findings as a benchmark for high-volume independent restaurants using Avocado, not a national census.
No restaurant, employee or customer is identified in the analysis.
Frequently asked questions
What is the definition of menu engineering?
Menu engineering is a method for comparing item popularity and contribution margin so a restaurant can improve pricing, placement, promotion and menu complexity.
How do you calculate menu item contribution margin?
Subtract an item's variable cost from its selling price. For an item priced at $17 with $6 in variable costs, contribution margin is $11 per item. Multiply by units sold to compare total contribution dollars; fixed costs are not included.
What are the four menu engineering categories?
The standard matrix categories are Stars (high popularity and high margin), Plowhorses (high popularity and low margin), Puzzles (low popularity and high margin), and Dogs (low popularity and low margin).
Does the 80/20 rule mean I should remove 80% of my menu?
No. The rule describes sales concentration; it does not prescribe a menu size. Check margin, ingredient overlap, seasonality, audience needs and kitchen complexity before removing an item.
Should I measure units sold or item sales?
Measure both. Units reveal operational volume, while item sales reflect price as well as demand. Add contribution margin when food-cost data is available.
How often should a restaurant run a menu analysis?
Review high-level sales mix monthly and perform a deeper popularity-and-margin analysis quarterly. Use a full year when studying seasonality.
Is menu optimization the same as menu engineering?
Menu engineering is the measurement framework. Menu optimization is the broader work that follows, including pricing, descriptions, design, ordering flow and kitchen execution.
The bottom line
Restaurant menu engineering starts by finding the few items that carry the business, then checking whether those items also produce healthy contribution margin.
The strict 80/20 rule did not describe most restaurants in this study. A better shorthand for the median location was 75/20: the top fifth of sold items generated about three-quarters of item sales.
Know which items form that core. Protect their execution, add recipe cost and use the menu engineering matrix before deciding what to promote, reprice or remove.
Avocado brings item-level sales, payments and restaurant reporting into one connected system. Book an Avocado demo to see which items are carrying your menu.


